Monitoring Oxla cluster using Prometheus and Grafana
While developing OXLA, we are very concerned about resource utilization. It gets even more important when we are working with multi-node deployments. Finding bugs across multiple machines is not an easy task, especially without proper tooling. This is why we've made our database support Prometheus. This is a great tool for development and testing and even better for administration of running clusters. In this article, I'll show you how to set up Prometheus with Grafana to have basic monitoring of multi-node clusters with visualization.
What you need
- Docker
- Basic docker compose familiarity
- 15 minutes
OXLA setup
To get started, follow these steps:
1. Run the OXLA cluster by following the "Run OXLA in 2 minutes" instruction. This command exposes the required ports to both PostgreSQL (port 5432) and OXLA (port 8080), which supports Prometheus.
2. Once your OXLA cluster is up and running, use the following Curl to verify that metrics are exposed on localhost: 8080.
Learn more about the details of metrics here.
Prometheus and Grafana setup
Now, we can go straight to our bread and butter – getting OXLA metrics visualized with Grafana! Follow these steps to set up the environment using Docker Compose.
Step 1: Create a Docker Compose Configuration
Create a docker-compose.yml file with the following content:
We are starting two services, Grafana and Prometheus, using their official docker images. For each of these, the configuration must be placed in the same directory next to the docker-compose.yml file.
Step 2: Configure the Prometheus
Create a prometheus_config.yml file with the following content:
Except for some basic settings for the Prometheus, we need to set up the exact endpoints of our clusters in the targets list. Replace [OXLA_IP] with the actual address of the machine you are running OXLA on.
Step 3: Configure the Grafana Data Sources
To set up Grafana, you must configure two data sources:
- Prometheus: on the same Docker network (for a single Compose setup).
- OXLA nodes: You can visualize the actual data stored in your cluster and configured as
type: Postgresfor binary-level protocol compatibility.
Create a datasources.yml file with the following content:
Step 4: Run the Monitoring
Execute the following command to start Prometheus and Grafana:
Step 5: Verify Grafana Frontend
Ensure that the Grafana frontend is accessible in your browser at localhost:3000.
Setting up the Grafana dashboard
From now on, the only limiting factor is our creativity (and the software we use ;P). FYI – all of the screenshots below were taken on the slight cluster I use for daily development consisting of 3 nodes to make the graphs more interesting.
1. Firstly, let's log in to Grafana using our definitely safe default credentials:
2. Create a new dashboard using dashboard⇾Create New.

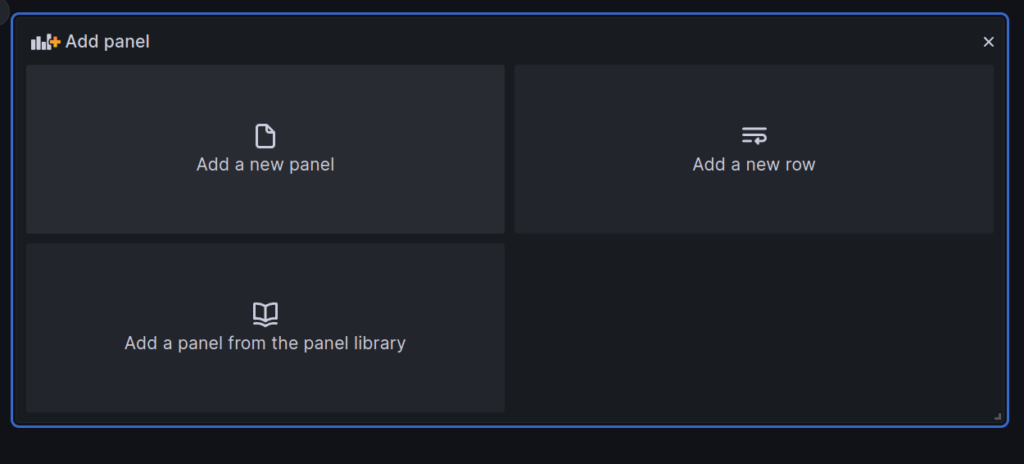
3. Add the first panel by selecting Add Panel on the top right and choosing Add new panel.
4. Set the Data source to Prometheus.

5. Choose the metric num_nodes_connected without any additional label filter.

6. Set the Title in Panel options as Connectivity Checks.

7. The panel displays the operational status of the cluster and ensures continuous connectivity across all three nodes. By analyzing charts, you can quickly identify anomalies and downtime. This scenario shows that the node experienced downtime between 23:05 and 23:12.

Some more useful panels
You can enhance the Grafana dashboard by adding two more insightful panels, Memory Usage and Query Handling. Let's see the following scenario:
- Add a Memory Usage Panel:
- Add a new panel by selecting the
Add panelon the top right and choosingAdd new panel. - Set the metric to monitor as
oxla_memory_usage_bytes. - Specify Label Filters with the value
memory_consumption_total. - Since OXLA reports mem usage in bytes, convert memory usage from bytes to megabytes by clicking
+ Operations➔Binary operations➔Divide by scalar. Set the scalar value to2^20.
- Add a new panel by selecting the
- Add Queries Per Minute Panel:
- Add another panel by selecting the
Add panelon the top right and choosing theAdd new panel. - Set the metric to monitor as
delta(client_sql_queries_total{query_type="INSERT"}[1m]). - This metric calculates the delta of total queries processed in one minute (
query_type= "INSERT").
- Add another panel by selecting the
The new dashboard will look something like this:

We can, of course, continue extending our dashboards. I hope you find it useful.
Explore the capabilities of Oxla's integration with Prometheus and Grafana to gain in-depth insights into your multi-node clusters. It's quick, easy, and during the beta phase – completely free of charge: Run Oxla in 2 minutes - Oxla Developer Hub. If you find this article interesting, would like to share your thoughts about Oxla, or simply say 'hi,' feel free to contact us at hello@oxla.com.